Why Python?
Python really shines due to its ease of use, clear syntax, and versatility. It's a breeze for newcomers to programming and a powerful ally for seasoned coders. Its diverse libraries and frameworks cover a wide spectrum of data analysis needs:
- Pandas for Data Manipulation: Handling big datasets becomes a piece of cake with Pandas. Its data structures and tools make it a breeze to clean, analyze, and present data.
- Matplotlib for Data Visualization: Need to make sense of complex data? Matplotlib is your friend. Whether it's simple line graphs or intricate 3D models, this library has you covered.
- Scikit-learn for Machine Learning: With machine learning becoming more integral in predictive analytics, Scikit-learn offers a user-friendly suite of tools for various machine learning algorithms.
Data Manipulation with Pandas
Pandas, a cornerstone Python library, is a game-changer in data manipulation. It offers DataFrame objects - two-dimensional, size-mutable, and potentially heterogeneous tabular data structures with labeled axes (rows and columns). This makes it incredibly efficient for handling complex data sets often encountered in criminal justice intelligence.
Example:
Let's say we have a file named 'criminal_data.csv' filled with data on various criminal incidents, including details like 'Incident_ID', 'Crime_Type', 'Location', 'Date', and 'Number_of_Suspects'. Here's a sneak peek at the first few rows:
| Incident_ID | Crime_Type | Location | Date | Number_of_Suspects |
|---|---|---|---|---|
| 1001 | Burglary | Downtown | 2022-01-15 | 2 |
| 1002 | Assault | Suburban | 2022-01-16 | 1 |
| 1003 | Cybercrime | Online | 2022-01-17 | 1 |
| 1004 | Vandalism | Downtown | 2022-01-18 | 3 |
| 1005 | Theft | Suburban | 2022-01-19 | 2 |
| ... | ... | ... | ... | ... |
import pandas as pd

# Loading a dataset
data = pd.read_csv('criminal_data.csv')

# Exploring the basic dataset statistics
print(data.describe())

# Viewing the first five records
print(data.head())
With just a few lines of Python code, we can load this dataset, get a quick statistical summary, and take a peek at the initial rows. This gives us a clear view of what we're dealing with right off the bat.
The Python script would output the following:
-
Basic Dataset Statistics (data.describe()): This would provide statistical summaries for all numeric columns (like 'Number_of_Suspects'). It typically includes count, mean, standard deviation, min, 25th percentile, median (50th percentile), 75th percentile, and max.
Number_of_Suspects count 5.000000 mean 1.800000 std 0.836660 min 1.000000 25% 1.000000 50% 2.000000 75% 2.000000 max 3.000000 - First Five Records (data.head()): This would display the first five rows of the dataset as shown in the table above.
Incident_ID  Crime_Type  Location  Date        Number_of_Suspects
1001         Burglary    Downtown  2022-01-15  2
1002         Assault     Suburban  2022-01-16  1
1003         Cybercrime  Online    2022-01-17  1
1004         Vandalism   Downtown  2022-01-18  3
1005         Theft       Suburban  2022-01-19  2
Data Visualization with Matplotlib
When it comes to making sense of data visually, Matplotlib is a game-changer. It allows analysts to create clear, intuitive visual representations of complex datasets. Spotting patterns, trends, and correlations becomes much easier with this tool in your arsenal.
Example:
Imagine we want to compare different types of crimes. A few lines of code can produce a bar chart that brings the data to life, making it straightforward to compare the frequency of various crime types.
import matplotlib.pyplot as plt

# Sample data
categories = ['Burglary', 'Assault', 'Cybercrime']
values = [50, 200, 80]

# Creating a bar chart
plt.bar(categories, values, color=['blue', 'green', 'red'])
plt.title('Crime Statistics')
plt.xlabel('Crime Type')
plt.ylabel('Number of Incidents')
plt.show()
It would output an image that looks like the following: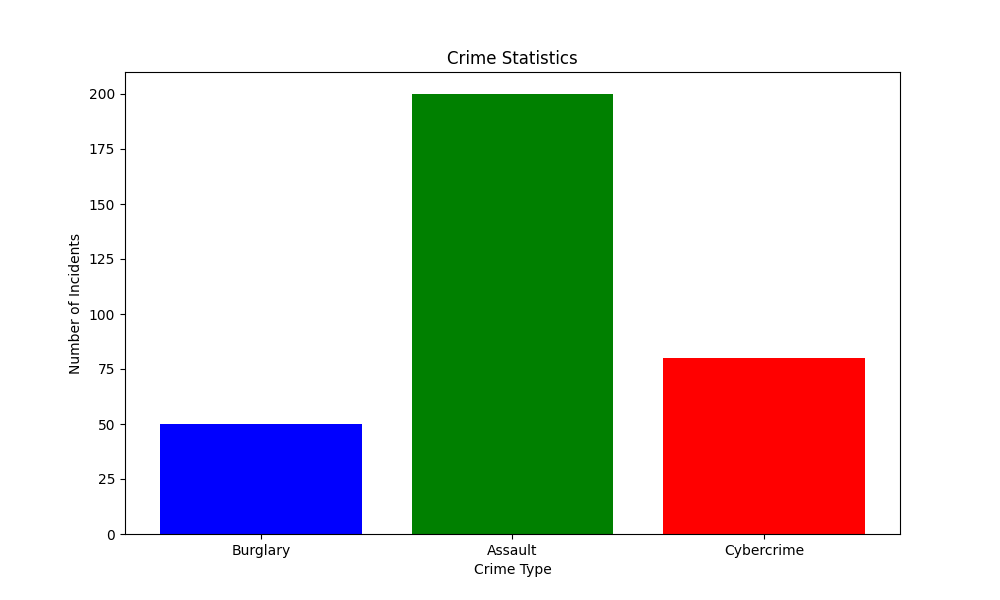
Machine Learning with Scikit-learn
Scikit-learn is your gateway to the world of machine learning within criminal justice. From clustering to classification, it provides the tools to uncover patterns and forecast future trends based on past data.
Example:
By applying something like the K-Means clustering algorithm, we can start identifying patterns or groups within crime data. The script will show us which data points belong to which cluster, giving us insight into how these crimes might be grouped together.
from sklearn.cluster import KMeans
import numpy as np

# Sample data
X = np.array([[1, 2], [1, 4], [1, 0], [10, 2], [10, 4], [10, 0]])

# Applying K-Means clustering
kmeans = KMeans(n_clusters=2, random_state=0).fit(X)
print("Cluster labels:", kmeans.labels_)
print("Cluster centers:", kmeans.cluster_centers_)
This example demonstrates how to apply a K-Means clustering algorithm, which can be used to identify patterns or groups within crime data.
When executed, the script produces the following output:
-
Cluster Labels:
[1, 1, 1, 0, 0, 0]This indicates the cluster assignment for each data point in the array
X. The first three points ([1, 2],[1, 4],[1, 0]) are assigned to cluster1, and the last three points ([10, 2],[10, 4],[10, 0]) are assigned to cluster0. -
Cluster Centers:
The centers of the two clusters are:
- Cluster
0:[10., 2.] - Cluster
1:[ 1., 2.]
These points represent the central location of each cluster, calculated as the mean of the points assigned to each cluster. Cluster
0is centered around the point(10, 2), and cluster1is centered around the point(1, 2) - Cluster
Note on the K-Means Algorithm
In our example of using the K-Means clustering algorithm with Scikit-learn, we briefly showcased how this technique can be applied to identify patterns or groups within crime data. However, it's important to note that the inner workings and the mathematical underpinnings of the K-Means algorithm are quite intricate and extend beyond the scope of this introductory article.
K-Means involves several complex steps, such as initializing centroids, assigning data points to the nearest cluster, recalculating centroids, and iterating this process until the clusters are as consistent as possible. Understanding these processes in detail requires a deeper dive into topics like Euclidean space, convergence criteria, and the algorithm's sensitivity to the initial placement of centroids.
Our focus here is to provide a practical overview of how Python and its libraries can be applied in the field of criminal justice intelligence. For those interested in the detailed mechanics of K-Means or other machine learning algorithms, we recommend exploring specialized resources or advanced texts that delve into the mathematical aspects of these techniques.
In future articles, we may explore these complex algorithms in more detail, particularly how they relate to real-world applications in criminal justice and data analysis. For now, we encourage readers to experiment with the basic applications of these tools, as understanding their practical implementation can provide a strong foundation for more advanced study.
Conclusion
Python's blend of simplicity and robust capabilities makes it an invaluable asset in the toolkit of criminal justice intelligence analysts. By leveraging its strengths in data manipulation, visualization, and machine learning, these professionals are able to transform intricate data sets into actionable insights. This proficiency is essential not only in addressing current challenges in crime but also in equipping analysts with the foresight to anticipate and prepare for future issues, thereby enabling the development of more strategic and effective approaches in criminal justice.
Looking Ahead
In an upcoming article, we will introduce the fundamentals of statistics and their application in criminal justice intelligence. The discussion will cover essential statistical concepts such as probability distributions, hypothesis testing, and the importance of statistical significance. These elements are crucial for analysts to interpret data accurately and to make informed conclusions. A thorough understanding of these statistical principles is vital in reinforcing the decision-making process in criminal justice, providing a deeper and more nuanced perspective in data analysis.